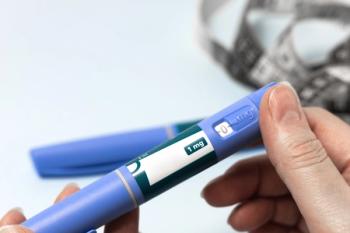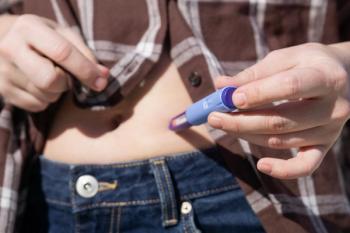
A claims analysis of 2031 patients aged 10 to 17 years found that nutrition counseling was infrequent and often began months after treatment started.
Data show that TyG-WC, an index combining insulin resistance and central adiposity, is the only surrogate marker independently linked to osteoporosis.
A single-center retrospective study of adults with type 2 diabetes (T2D) found that triglyceride glucose-waist circumference (TyG-WC), an insulin resistance index adjusted for central adiposity, was independently associated with quantitative computed tomography (QCT)-defined osteoporosis, and the unadjusted TyG index and the body mass index (BMI)-adjusted TyG-BMI index were not.1
The study, published in Frontiers in Molecular Biosciences, evaluated 568 patients with T2D, of whom 36 (6.3%) had QCT-confirmed osteoporosis, and compared the 3 indices head-to-head using Firth's penalized-likelihood logistic regression to address a low events-per-variable ratio.1
Investigators at the Department of Orthopedics at Shanghai Pudong Hospital at Fudan University Pudong Medical Center conducted a retrospective, cross-sectional analysis of consecutive patients with T2D admitted to the hospital's endocrinology department between June 1, 2023, and June 30, 2025.1
Eligible patients were 18 years or older with physician-confirmed T2D and complete demographic, anthropometric, biochemical, and lumbar QCT bone mineral density (BMD) data. Patients with known secondary osteoporosis, chronic diseases or medications substantially affecting bone metabolism, prior fragility fracture, or current antiosteoporosis drug treatment were excluded.1
Osteoporosis was defined according to the Chinese guideline for diagnosis of osteoporosis with QCT (2018) as lumbar (L1-L3) volumetric bone mineral density (BMD) of 80 mg/cm³ or less. The authors noted that WC serves as an anthropometric proxy for visceral adipose tissue, which they hypothesized to be the most metabolically active and bone-deleterious fat depot.1
At the univariable level, all 3 IR-related indices were significantly higher in patients with OP than in those without (all P < .001): TyG median of 9.10 versus 8.61, TyG-BMI of 226.79 versus 193.95, and TyG-WC of 817.13 versus 710.80. After adjustment for 9 covariates selected through least absolute shrinkage and selection operator regression and variance inflation factor screening—sex, age, hemoglobin (HGB), high-density lipoprotein cholesterol, hemoglobin A1C (HbA1C), procollagen type 1 N-terminal propeptide, osteocalcin (OC), bone-specific alkaline phosphatase (BAP), and serum calcium—only TyG-WC remained statistically significant (OR, 1.004 per unit; 95% CI, 1.001-1.008; P = .013).1
TyG showed a positive but nonsignificant association (OR, 1.871; 95% CI, 0.938-3.819; P = .075), as did TyG-BMI (OR, 1.002; 95% CI, 0.999-1.005; P = .105).1
Across all 3 models, male sex and higher HGB were independently protective against OP, and higher HbA1c, OC, and BAP independently increased OP odds. A quartile-based analysis showed the adjusted odds of OP rose monotonically from the first to fourth quartile of TyG-WC (trend P = .003), and restricted cubic spline analysis confirmed an approximately linear positive relationship. Two prespecified sensitivity analyses—conventional maximum-likelihood logistic regression and ridge logistic regression—produced directionally concordant estimates.1
Apparent area under the receiver-operating-characteristic curve (AUC) values were 0.896 (95% CI, 0.856-0.936) for TyG, 0.887 (95% CI, 0.842-0.932) for TyG-BMI, and 0.901 (95% CI, 0.864-0.938) for TyG-WC. Pairwise DeLong tests did not establish statistically significant superiority of any single index: TyG-WC versus TyG-BMI showed a ΔAUC of 0.014 (P = .141), and TyG-WC versus TyG showed a ΔAUC of 0.005 (P = .509). Optimism-corrected AUCs from 1,000 bootstrap resamples were 0.866, 0.860, and 0.870 for the TyG, TyG-BMI, and TyG-WC models, respectively, with acceptable calibration across all 3.1
When the authors tested whether TyG-WC added discriminative value beyond established markers, the full TyG-WC model's AUC of 0.901 did not reach statistical significance compared with an HbA1C-alone model, which had an AUC of 0.885 (ΔAUC, 0.016; P = .514). Individual standard markers used alone—including fasting plasma glucose, BMI, WC, OC, BAP, and HGB—all showed significantly lower discrimination than the full TyG-WC model (all P < .001).1
The study authors proposed that the independent significance of TyG-WC, rather than TyG or TyG-BMI, reflects the specific role of visceral adipose tissue in bone-damaging endocrine signaling. They noted that visceral fat secretes elevated levels of proinflammatory cytokines such as tumor necrosis factor alpha (TNF-α) and interleukin-6 (IL-6), along with reduced adiponectin and increased leptin, and that this adipokine imbalance may promote bone resorption while suppressing bone formation. The authors cautioned, however, that this interpretation should be made carefully because the AUC differences between models were small and not statistically significant.1
This mechanistic framing is consistent with broader literature on diabetic bone disease. A separate clinical review in Metabolism Open describes how insulin resistance, hyperglycemia, advanced glycation end products, and proinflammatory cytokines collectively disrupt osteoblast and osteoclast function in T2D and notes that adipose tissue acts as an active endocrine organ that can worsen bone quality independent of standard bone mineral density readings.2
A review in Reumatologia similarly points out that patients with T2D often present with normal or even elevated BMD by dual-energy x-ray absorptiometry yet still carry an elevated fracture risk, underscoring why bone quality indicators beyond density—such as trabecular bone score or, potentially, metabolic surrogates like TyG-WC—may add clinical value.3
Higher levels of the bone-formation markers OC and BAP were independently associated with increased, not decreased, odds of OP across all 3 models. The study authors described this as consistent with a "low-but-uncoupled" bone-turnover phenotype increasingly recognized in diabetic osteoporosis, in which compensatory or disordered turnover signals coexist with poor underlying bone quality. They cautioned that bone-turnover markers in T2D should be interpreted alongside imaging rather than as standalone risk indicators.1
For pharmacists and other clinicians managing patients with T2D, the study's central message is that BMD-based screening tools alone may not capture the full skeletal risk in this population. The authors position TyG-WC—calculated from fasting triglycerides, fasting glucose, and a waist-circumference measurement, all routinely available in clinical practice—as a potential low-cost adjunct for identifying patients with T2D who may warrant earlier QCT assessment.1
However, they explicitly stopped short of recommending TyG-WC as a standalone screening tool, citing its modest incremental discrimination over HbA1C and bone-turnover markers already in common use.1
The authors also noted that where an anthropometry-augmented IR index is used pragmatically, the choice between TyG-BMI and TyG-WC may come down to which anthropometric measurement is more reliably obtained at a given clinic.1
The study authors identified several limitations. The cross-sectional design precludes causal inference, and with only 36 OP events, confidence intervals remained wide even after Firth penalization, and the authors noted the ranking among the 3 IR indices should be considered exploratory. The single-center, tertiary-care cohort limits generalizability to community settings, and no nondiabetic control group was included by design, since the study addressed risk stratification within T2DM rather than whether IR-OP associations are specific to diabetes.1
The authors also noted that information on diabetes duration, antidiabetic and anti-osteoporotic medication history, menopausal status, vitamin D supplementation, physical activity, and fall history was incomplete or unavailable, meaning residual confounding is possible and adjusted estimates should be interpreted as upper bounds. The authors called for prospective, external validation in larger, multicenter, and ideally paired diabetic/nondiabetic cohorts before any clinical recommendation on TyG-related indices for osteoporosis screening in T2D can be made.1